
Board meetings usually go sideways the moment someone asks "what happens if we add another major gift officer?" or "can we hit $3.2M with current staffing?" Everyone starts throwing around anecdotal success stories while the CFO quietly calculates payroll burn in the corner.
The real problem isn't that fundraising teams can't answer these questions. It's that most nonprofits track activities instead of capacity-to-output relationships. They know Sarah made 47 donor calls last month but have no idea what their entire team's donor touchpoint capacity actually is, or what revenue that capacity predictably generates.
Why traditional fundraising projections fail at the board level
Most development teams present projections based on past performance trends and gut feelings about upcoming campaigns. The board sees a hockey-stick revenue graph and asks reasonable questions about staffing, campaign timing, and resource allocation. Then everything unravels.
The development director starts explaining how major gifts work differently than annual fund appeals, while the executive director tries to translate donor pipeline stages into something the business-minded board members recognize. Meanwhile, nobody can actually show the mathematical relationship between adding a grant writer versus investing those same dollars into direct mail capacity.
This happens because nonprofits typically manage fundraising through relationship narratives rather than operational capacity models. A fundraising capacity model nonprofit boards can actually use needs to translate messy human relationships into predictable operational outputs — without losing the nuance that makes philanthropy work.
Organizations that get this right treat their development operation like a production system with measurable inputs, processing capacity, and yield rates. Not because donors are widgets, but because boards need to make resource allocation decisions based on something more concrete than "trust us, major gifts take time."
Mapping roles to actual revenue-generating capacity
Start with what each fundraising role can realistically handle in terms of donor relationships and touchpoints. A major gift officer managing a portfolio of 125 donors can maintain roughly 8-10 meaningful touchpoints per donor annually. That's around 1,100 structured interactions per year, assuming they spend 70% of their time on direct donor engagement.
Stop missing fundraising opportunities.
Almosly helps you plan, track, and optimize every campaign with ease.
- Centralized donor and volunteer management
- Automated engagement workflows
- Impact and fundraising analytics
No credit card required
Raw activity counts mean nothing without understanding conversion mechanics. Map each role type to their actual revenue-generating activities:
Major Gift Officers
-
Portfolio capacity
100-150 active donors
-
Meaningful touchpoints per donor
8-12 annually
-
Average solicitations per year
35-45
-
Typical close rate
60-70% on solicitations
-
Average gift size range
$25k-100k
-
Annual revenue capacity
$750k-2.5M per FTE
Corporate Partnership Managers
-
Active partnership capacity
20-30 organizations
-
Cultivation meetings per month
15-20
-
Proposals submitted quarterly
8-12
-
Typical close rate
35-45%
-
Average partnership value
$15k-75k
-
Annual revenue capacity
$400k-1.2M per FTE
Annual Fund Coordinators
-
Direct mail campaigns managed
8-12 annually
-
Digital appeals coordinated
24-36 annually
-
Donor segments actively managed
6-8
-
Giving day events executed
2-3
-
Revenue influenced
$250k-500k per FTE
The ranges are wide because capacity depends on your donor base, mission alignment, and operational support. A major gift officer at an established university foundation operates very differently than one at a regional food bank.
Building FTE-equivalent scenarios boards can manipulate
Boards think in scenarios and trade-offs. They want to know what happens if you shift resources from events to major gifts, or whether hiring two part-time grant writers equals one full-time corporate partnerships person.
Create FTE-equivalent calculations that account for role productivity differences. A 0.5 FTE major gift officer doesn't generate half the revenue of a full-time officer because relationship building doesn't scale linearly. They might only manage 40 donors effectively instead of 125, reducing their revenue capacity to roughly 30% of a full-time equivalent.
| Scenario | Team Composition | Annual Capacity | Cost | Net ROI |
|---|---|---|---|---|
| Baseline | 2 MGO, 1 CPM, 2 AF | $3.2M-4.8M | $420k | 6.6-10.4x |
| Add MGO | 3 MGO, 1 CPM, 2 AF | $4.0M-6.3M | $510k | 6.8-11.4x |
| Add Grants | 2 MGO, 1 CPM, 2 AF, 1 GW | $3.6M-5.4M | $480k | 6.5-10.3x |
| Shift to Digital | 2 MGO, 1 CPM, 1 AF, 1 Digital | $3.4M-5.2M | $435k | 6.8-11.0x |
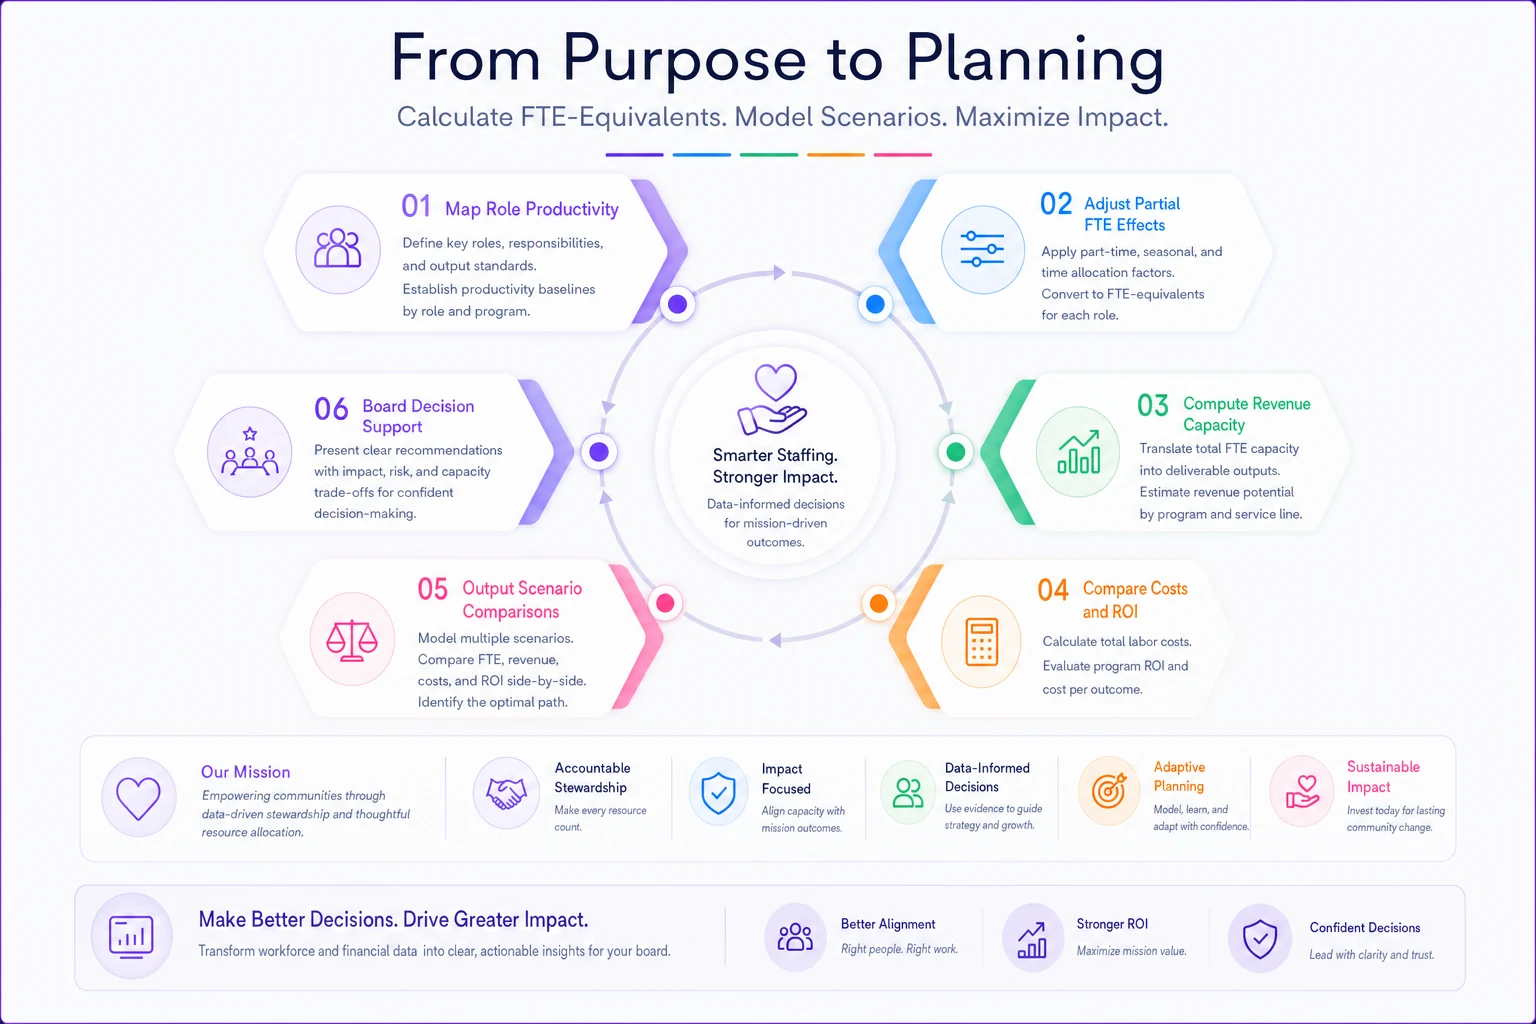
Here's a quick visual of the steps a team follows to translate role-time into scenario-ready outputs.
Adding a grant writer increases total capacity less than adding another major gift officer, but at lower cost and lower risk. The board can now have a real conversation about risk tolerance versus growth targets instead of guessing.
Campaign cadence and the compound effect on capacity
Campaign timing affects capacity more than most organizations realize. Running a capital campaign while maintaining annual fund operations essentially requires 140% of your team's normal capacity for 18-24 months. But almost nobody plans for this mathematically.
Map your standard campaign calendar against role capacity to identify collision points. If your major gift officers need to conduct 40 solicitations for the capital campaign while maintaining their regular portfolio, something breaks — usually annual fund retention rates, which then undermines future major gift pipelines.
A proper capacity model surfaces these conflicts months in advance. You can model scenarios like:
-
Hiring temporary campaign staff
-
Reducing annual fund frequency during campaign peaks
-
Staggering regional campaign rollouts
-
Pre-loading stewardship activities before campaign launch
One health system foundation discovered their planned fall campaign schedule would require their team to execute 37 events in 45 days — physically impossible without gutting quality across the board. They only caught it because someone actually mapped hours against the calendar.
Predictable yield rates (and when they break)
Fundraising yield rates follow predictable patterns until they don't. A fundraising capacity model nonprofit leaders can trust needs to account for both normal variance and breakdown conditions.
Standard yield progressions look something like:
-
First-time donor to second gift
18-25%
-
Year 2 to year 3 retention
45-55%
-
Active to lapsed
35% annually without intervention
-
Lapsed reactivation rate
8-12% with targeted campaigns
-
Annual to major gift conversion
0.8-1.2% of qualified pool
These rates deteriorate predictably under specific conditions. Add 20% more donors to a major gift officer's portfolio and their retention rate drops 8-10 points. Run three emergency appeals in six months and annual fund response rates crater by around 30%.
Your capacity model needs circuit breakers that flag when you're pushing beyond sustainable limits. If the model shows you need 160% of available capacity to hit revenue targets, that's not a stretch goal — that's a guaranteed failure point.
The decision knobs that actually matter
Board members want simple levers they can pull to affect outcomes. Give them four to six "decision knobs" that meaningfully move the model:
Staffing Mix Knob Ratio of major gifts to annual fund to grant writing capacity. Moving this toward major gifts increases revenue potential but also increases risk and time-to-revenue.
Portfolio Density Knob Number of donors per officer. Lower density means better relationships and higher average gifts but higher cost per dollar raised.
Campaign Frequency Knob Number of annual fund appeals and campaigns. More frequency initially drives revenue but eventually causes donor fatigue and decreases lifetime value.
Technology Investment Knob Level of operational automation and donor lifecycle support. Higher investment reduces manual work per donor, letting officers handle larger portfolios or spend more time on high-value activities.
Geographic Focus Knob Concentration versus distribution of fundraising efforts. Tighter geographic focus increases efficiency but limits market size.
Each knob should show clear trade-offs. Increasing portfolio density from 125 to 175 donors per officer might increase total revenue by 20% but decrease retention rates by 15% and average gift size by 10%. The board can now make informed decisions rather than assuming more activity equals more revenue.
When the model reveals uncomfortable truths
Sometimes the capacity model tells you things nobody wants to hear.
A mid-sized arts organization discovered their special events were actually costing them money when you factored in opportunity cost of staff time. Three signature galas consumed 2,400 hours of staff capacity annually while netting $180k — roughly $75 per hour. Those same hours focused on major gift cultivation would have yielded $400k+.
A social services nonprofit realized their grant writing operation was masking fundamental annual fund weaknesses. Grants provided 60% of revenue but consumed 30% of development capacity. When two major grants weren't renewed, they had no sustainable donor base to fall back on.
The model also reveals positive surprises. One education nonprofit found their "underperforming" corporate partnerships person was generating the highest ROI when you factored in the multi-year nature of corporate commitments and lower cost-per-dollar-raised compared to events.
These insights only emerge when you model the full system rather than looking at each revenue stream in isolation.
Scenario modeling for board-ready conversations
Build three to five standard scenarios the board can quickly evaluate:
Conservative Growth Current team plus 0.5 FTE focused on retention. Shows 8-12% annual growth with minimal risk.
Aggressive Expansion Add 2 major gift officers and 1 corporate partnership manager. Projects 25-35% growth but requires 18 months to full productivity.
Digital Transformation Shift 1 FTE from events to digital fundraising and add automation tools. Similar revenue with 30% less staff time required.
Campaign Mode Temporary 40% capacity increase for a 24-month capital campaign, then return to baseline with improved infrastructure.
Efficiency Focus No new hires, but optimize portfolio sizes and implement volunteer capacity to handle administrative tasks. Shows roughly 15% capacity gain.
Each scenario should include:
-
Revenue projection with confidence intervals
-
Required investment and timeline
-
Key risks and mitigation strategies
-
Impact on donor retention and lifetime value
-
Break-even point and ROI timeline
Each scenario should include:
Technology multipliers hidden in the capacity equation
Most organizations don't quantify efficiency gains from automation in their capacity models, which means they're consistently underestimating what their teams can actually do. AI-powered operational software can handle donor research, gift processing, acknowledgment letters, and basic stewardship tasks that currently consume 30-40% of development staff time.
A development associate spending 15 hours weekly on data entry and gift processing could redirect that time to donor engagement. That's 750 hours annually — equivalent to adding roughly 0.4 FTE of donor-facing capacity without adding headcount.
The multiplier effect compounds across the team. Automated donor research means major gift officers spend less time qualifying prospects. Automated acknowledgment workflows mean faster gift processing and better donor experience. Centralized dashboards mean less time building board reports and more time actually fundraising.
One regional healthcare foundation implemented AI-assisted operations and saw revenue-per-FTE increase from $420k to $580k over about 18 months. Not through magic — by systematically removing administrative friction from every donor interaction.
Making the model stick beyond the boardroom
The best fundraising capacity model becomes useless if it only appears during board meetings. Operations teams need simplified versions for quarterly planning. Development directors need real-time capacity visibility. Individual fundraisers need to understand how their daily activities connect to organizational outcomes.
Create tiered versions of the model:
-
Board version
High-level scenarios and decision knobs
-
Director version
Detailed capacity planning and resource allocation
-
Manager version
Team capacity tracking and portfolio optimization
-
Individual version
Personal capacity management and activity prioritization
Each version should tell the same story with different levels of detail. When a major gift officer sees their portfolio is at 115% capacity, they understand why response times are slipping. When the board sees team capacity at 115%, they understand why revenue projections might not materialize.
Track capacity utilization weekly, not quarterly, so you spot overload before it becomes a revenue problem.
The model becomes a shared language for discussing fundraising operations. Instead of arguing about whether to hire another person, you can discuss whether current capacity utilization justifies expansion or whether efficiency improvements should come first.
Converting model insights into operational reality
Having a clean capacity model means nothing if you can't operationalize it. The organizations that successfully implement these models share a few characteristics.
They track actual capacity utilization weekly, not just outcomes quarterly. If your model says a major gift officer should handle 125 donors but they're actually managing 180, you've identified why renewal rates are dropping before it shows up in revenue reports.
They adjust quickly when reality diverges from projections. When corporate partnerships suddenly require twice as many touchpoints to close, they either reduce portfolio size or adjust revenue projections rather than hoping things turn around.
They protect capacity margins. Just like manufacturing operations need slack for maintenance and unexpected demand, fundraising teams need a 15-20% capacity buffer for donor emergencies, unexpected opportunities, and basic human sustainability.
Most importantly, they use the model to say no strategically. When the board wants to add another gala because last year's was successful, the model shows the opportunity cost in concrete terms. When program staff want development to pursue a questionable grant opportunity, the capacity implications are right there on the page.
The path from spreadsheet projections to predictable operations
Moving from traditional fundraising projections to a real capacity model takes around six months of disciplined data collection and testing. Start by tracking actual time allocation for each role for 90 days. Not what people think they do — what they actually do.
Then map those activities to outputs. How many solicitations actually happened? What was the close rate? What was the average processing time? This baseline data becomes the foundation for your capacity assumptions.
Test the model against historical performance. If the model says your team had capacity for $3M last year but you raised $2.2M, either your capacity assumptions are wrong or you have an execution problem. Both insights are worth having.
Once validated, use the model to make one significant operational decision and track results. Maybe you reallocate one person from events to major gifts, or reduce portfolio sizes by 20%. The results will show whether your model reflects operational reality or needs adjustment.
After six months, you'll have a capacity model that board members trust, development directors can plan with, and fundraisers actually understand. More importantly, you'll have transformed fundraising from relationship alchemy into predictable operations without losing the human element that makes philanthropy work.
The spreadsheet projections you used to dread for board meetings become living operational tools. Resource allocation discussions shift from political negotiations to data-informed decisions. And your fundraising team finally has a clear answer when someone asks "what would it take to raise another million dollars?"
The answer stops being "we'll try harder" or "we need to find more major donors." It becomes "we need 1.3 additional FTEs of major gift capacity, or we need to improve our close rate from 60% to 72%, or we need to increase average gift size by $8,500." Those are things a board can actually evaluate and fund.
That's what a proper fundraising capacity model gives you — it turns hope into planning, activity into capacity, and good intentions into predictable outcomes.
Ready to elevate your nonprofit impact?
Join 2,000+ nonprofits using Almosly to boost fundraising efficiency, deepen donor relationships, and scale philanthropic impact.